Randomized Block Design
We use RBD experiments when the whole experimental area is not homogeneous. Variability is controlled by grouping the experimental area into relatively homogeneous groups known as blocks. Treatments are set into these blocks randomly and thus their means will give rise to unbiased estimates of the treatment effect.
For example, suppose you want to study the milk production in dairy cows on certain diets (D1, D2, D3 and D4). The diet is the treatment. We can introduce factor type of cow so as to limit the variability since it is known that different breeds of cows produce different amount of milk. So we let the blocks be ( B1, B2 and B3) which represent ( Friesian, Guernsey and Ayrshire) The statistical model of this experiment is as follows
Yij=µ+ αi+βj+εij
Where:
µ is the overall mean
αi is the effect if the ith treatment
βj is the effect of the jth block
εij is the random error which follows a normal distribution, (0,σ²).
The table below shows a summary of how an experiment with b blocks and v treatments can be arranged.
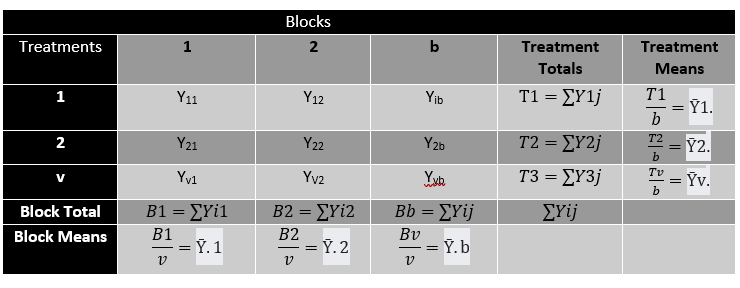 Note that:
N= vb
In this experiment we will seek to investigate test hypotheses:
-
The treatment effects differ significantly Null- αi=0, for all i Alternative- αi≠0, for any i
-
The block effects differ significantly
Null- βj=0, for all i
Alternative- βj≠0, for any i
ANOVA will be performed as shown in the table below
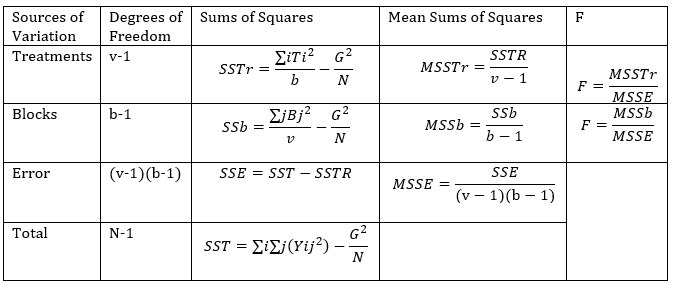
The F values computed will be compared with F tabulated values for the given significance level, F(df of error, df of total). If the computed value is greater than the tabulated value you reject the null hypothesis and conclude as required.
Example
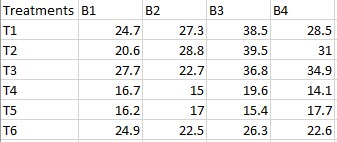 In this data, there are 4 blocks and 6 treatments. we are required to
test whether treatments and blocks differ significantly at 5%
significa
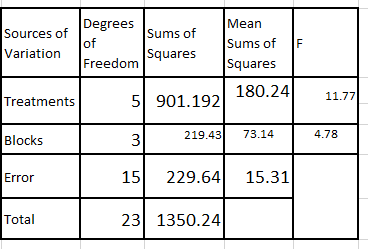 Following the steps shown you should obatin the ANOVA table as shown below;
From the results, the F value for treatments is compared with F(5,15)= 2.90. This is less than 11.77, we can reject the null hypothesis and conclude the treatment differ significantly.
As for the blocks, the value 4.78 is compared with F(3,15)=3.29, the null hypothesis is rejected.
Further tests can be applied to select the most significant block and treatment.
Rcode for analyzing RBD Experiments
library(readxl)
RBD <- read_excel("RBD.xlsx")
We will need to reshape the data into long format
library(reshape2)
library(dplyr)
RBD_new<-RBD %>%
  melt() %>%
  mutate(Block=variable,
         Treatments=as.factor(Treatments)) %>%
  select(-c(variable))
R uses Treatments as id variables to convert the data into long format. Check out the firts 9 observations of the long data format
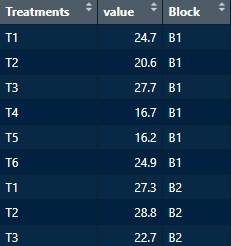
Performing ANOVA
Model3<-aov(value~Treatments+Block, data=RBD_new)
summary(Model3)
##             Df Sum Sq Mean Sq F value   Pr(>F)
## Treatments   5  892.9  178.59  11.518 0.000105 ***
## Block        3  216.7   72.22   4.658 0.017118 *
## Residuals   15  232.6   15.50
## ---
## Signif. codes:  0 '***' 0.001 '**' 0.01 '*' 0.05 '.' 0.1 ' ' 1
LSD.test(Model3,"Treatment", console = TRUE)
##
## Study: Model3 ~ "Treatment"
##
## LSD t Test for value
##
## Mean Square Error:  15.505
##
## Treatments,  means and individual ( 95 %) CI
##
##     value       std r      LCL      UCL  Min  Max
## T1 29.750 6.0451082 4 25.55356 33.94644 24.7 38.5
## T2 29.975 7.7684726 4 25.77856 34.17144 20.6 39.5
## T3 30.525 6.5250160 4 26.32856 34.72144 22.7 36.8
## T4 16.350 2.4200551 4 12.15356 20.54644 14.1 19.6
## T5 16.575 0.9945686 4 12.37856 20.77144 15.4 17.7
## T6 24.075 1.8518009 4 19.87856 28.27144 22.5 26.3
##
## Alpha: 0.05 ; DF Error: 15
## Critical Value of t: 2.13145
##
## least Significant Difference: 5.934661
##
## Treatments with the same letter are not significantly different.
##
##     value groups
## T3 30.525      a
## T2 29.975     ab
## T1 29.750     ab
## T6 24.075      b
## T5 16.575      c
## T4 16.350      c
LSD.test(Model3,"Block", console = TRUE)
##
## Study: Model3 ~ "Block"
##
## LSD t Test for value
##
## Mean Square Error:  15.505
##
## Block,  means and individual ( 95 %) CI
##
##       value       std r      LCL      UCL  Min  Max
## B1 21.80000  4.725251 6 18.37362 25.22638 16.2 27.7
## B2 22.21667  5.455059 6 18.79029 25.64305 15.0 28.8
## B3 29.35000 10.403990 6 25.92362 32.77638 15.4 39.5
## B4 24.80000  8.048354 6 21.37362 28.22638 14.1 34.9
##
## Alpha: 0.05 ; DF Error: 15
## Critical Value of t: 2.13145
##
## least Significant Difference: 4.845631
##
## Treatments with the same letter are not significantly different.
##
##       value groups
## B3 29.35000      a
## B4 24.80000     ab
## B2 22.21667      b
## B1 21.80000      b