Analysis of Staple Food Price in Kenya
This is a simple visualization project on the prices of staple food commodities in Kenya since 2005. The commodities include;
- Refined vegetable oil
- Gasoline
- Cow’s milk
- Diesel
- Maize meal
- Bread
Loading the Dataset and Required Packages
library(dplyr)
library(tidyr)
library(ggplot2)
library(readxl)
library(htmlwidgets)
staple_food_prices_data <- read_excel("staple food prices simplified.xlsx")
Cleaning the variables; changing column types and deleting unnecessary columns
staple_food_prices<-staple_food_prices_data %>%
  mutate(period_date=as.Date(period_date),
         value=as.numeric(value),
         value_one_month_ago=as.numeric(value_one_month_ago),
         value_five_years_ago=as.numeric(value_five_years_ago),
         value_two_years_ago=as.numeric(value_two_years_ago),
         value_three_years_ago=as.numeric(value_three_years_ago),
         value_four_years_ago=as.numeric(value_four_years_ago),
         value_one_year_ahead=as.numeric(value_one_year_ahead),
         value_one_year_ago=as.numeric(value_one_year_ago),
         two_year_average=as.numeric(two_year_average),
         five_year_average=as.numeric(five_year_average)) %>%
  select(-c(price_type,unit,unit_name,unit_type,status,status_changed,
            collection_status_changed,start_date))
Interactive Line Plot for the Products
plot<-ggplot(staple_food_prices) +
  aes(x = period_date, y = value, colour = product) +
  geom_line(size = 0.55) +
  scale_color_manual(
    values = c(Bread = "#A0522D",
               `Cow's Milk (Fresh,
    Pasteurized)` = "#00BFFF",
    Diesel = "#000000",
    Gasoline = "#FF0000",
    `Maize Meal` = "#228b22",
    `Refined Vegetable Oil` = "#FFA500")
  ) +
  labs(
    x = "Period",
    y = "Value",
    title = "Kenya Staple Food Prices ",
    subtitle = "Prices since 2005",
    color = "Product"
  ) +
  theme_bw() +
  theme(
    plot.title = element_text(size = 16L,
    face = "bold",
    hjust = 0.5),
    plot.subtitle = element_text(face = "italic")
  )
library(plotly)
foodplot<-ggplotly(plot) %>% layout(yaxis=list(fixedrange=TRUE),
        xaxis=list(fixedrange=TRUE))%>%
  config(displayModeBar=FALSE)
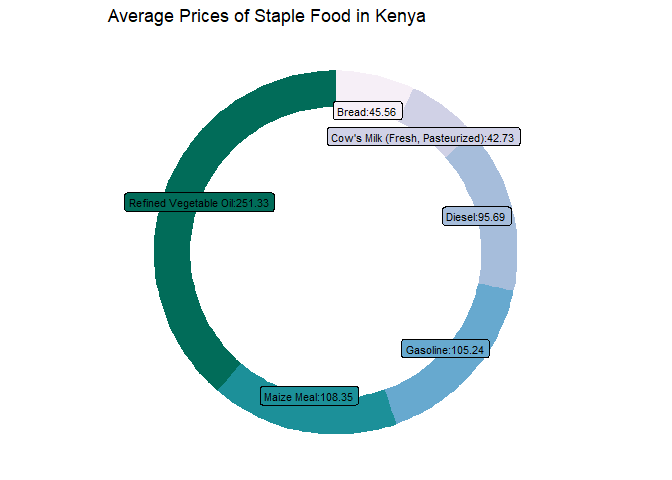
Average Prices of the products since 2005. This is visualized using a doughnut chart.
avg_prices<-staple_food_prices %>%
  drop_na() %>%
  select(product,value) %>%
  group_by(product) %>%
  summarise_at(vars(value), list(Average_Price=mean))%>%
  mutate(ratio=Average_Price/sum(Average_Price),
         Average_Price=round(Average_Price,2),
         cumulative_ratio=cumsum(ratio),
         ration_min=c(0, head(cumulative_ratio,n=-1)),
         labelPosition=(cumulative_ratio+ration_min)/2,
         label=paste0(product, ":", Average_Price))

ggplot(avg_prices,aes(ymax=cumulative_ratio, ymin=ration_min, xmax=4, xmin=3, fill=product))+
  geom_rect()+
  scale_fill_brewer(palette = 10)+
  geom_label(x=3.0,aes(y=labelPosition, label=label),size=3)+
  coord_polar(theta="y")+
  xlim(c(-1,4))+
  labs(title="Average Prices of Staple Food in Kenya")+
  theme_void()+
  theme(legend.position = "none")

Let’s select some few variables and transform our data set in to wider format. Wide format will help us compare the 6 commodities individually.
food_prices<-staple_food_prices %>%
  select(period_date,product,value) %>%
  mutate(product=as.factor(product))

food_prices_wide<-food_prices %>%
  pivot_wider(names_from = product,
              values_from = value)

food_prices_wide$period_date=as.Date(food_prices_wide$period_date)
Fuel prices often affect prices of commodities. To check on this theory, we compute the average price of diesel and gas per observation and compute correlations with other prices. A correlation value above 0.5 indicate towards strong positive association.
library(psych)
food_prices_wide %>%
  select(-period_date) %>%
  drop_na() %>%
  mutate(fuelavg= (Diesel+Gasoline)/2) %>%
  select(-c(Diesel,Gasoline)) %>%
  pairs.panels()

From the plot, all products indicate a correlation value of higher than 0.5. This confirms the claim that fuel prices in deed impact prices of other commodities.
Find the data and on my github reporsitory.